
Sprott Critical Materials ETF
Page Menu - SETM
As of February 26, 2026
NAV
$38.43
NAV Daily Change
-$0.05
 -0.13%
NAV Since Inception Cumulative Change1
 99.28%
Ticker
SETM
Market Price2
$38.57
Premium/Discount3
0.36%
Total Net Asset Value
$601.01 Million
Net Total Expense Ratio4
0.65%
Overview
Key Points
- Pure-Play† Critical Materials ETF – Provides pure-play access to a range of critical materials necessary to meet the rising global demand for energy.
- Increased Demand Driving Growth – Global demand for electricity may rise 157% by 2050;†† as technological advancements gain momentum, middle classes grow globally, and nations pursue net-zero emissions goals.
- Substantial Opportunity for the Foreseeable Future – To meet the world’s energy demands and 2050 net-zero targets, global investment in energy is likely to increase trillions of dollars,††† given population growth, economic expansion and technological advancements.
- Well-Positioned Companies – Companies upstream in the supply chain may be well-positioned to benefit from the increased investment in the critical materials necessary to meet rising global demand for electricity.
Investment Objective
Sprott Critical Materials ETF (Nasdaq: SETM) seeks to provide investment results that, before fees and expenses, correspond generally to the total return performance of the Nasdaq Sprott Critical Materials™ Index (NSETM™). The Index is designed to track the performance of a selection of global securities in the critical materials industry.
†The term “pure-play” relates directly to the exposure that the Fund has to the total universe of investable, publicly listed securities in the investment strategy.
††Source: IEA World Energy Outlook 2025, net-zero emissions scenario.
†††Energy Transition Investment Trends 2025, BloombergNEF.
Key Facts
Ticker
SETM
Listing Exchange
Nasdaq®
Benchmark Index
NSETM
Index Rebalance Frequency
Semi-Annually in June & December
ISIN
Show ISIN
ISIN: US85208P4028
Copyright 2026, American Bankers Association. CUISP Database provided by FactSet Research Systems Inc. All rights reserved.
CUSIP
Show CUSIP
CUSIP: 85208P402
Copyright 2026, American Bankers Association. CUISP Database provided by FactSet Research Systems Inc. All rights reserved.
Inception Date
February 1, 2023
Adviser
Sprott Asset Management USA, Inc.
Sub-Adviser
ALPS Advisors, Inc.
Distributor
ALPS Distributors, Inc.
Fees & Expenses4
| Management Fee | 0.65% |
| Other Expenses | 0.00% |
| Total Annual Fund Operating Expenses | 0.65% |
ETF Fund Details
February 26, 2026
Total Net Assets
$601,010,671.79
Shares Outstanding
15,640,000
Number of Holdings
126
Median 30 Day Bid Ask Spread
(As of 2/25/2026)
0.31%
Performance
Month-End Performance
Average Annual Total Returns (%) As of 1/31/2026
| Fund | 1 MO* | 3 MO* | YTD* | 1 YR | S.I.*1 |
| Sprott Critical Materials ETF (Net Asset Value) |
22.73 | 33.70 | 22.73 | 132.83 | 22.43 |
| Sprott Critical Materials ETF (Market Price)2 |
20.48 | 30.35 | 20.48 | 129.57 | 21.80 |
| Nasdaq Sprott Critical Materials™ Index (Benchmark)5 |
23.14 | 34.07 | 23.14 | 133.94 | 23.50 |
Quarter-End Performance
Average Annual Total Returns (%) As of 12/31/2025
| Fund | 1 MO* | 3 MO* | YTD* | 1 YR | S.I.*1 |
| Sprott Critical Materials ETF (Net Asset Value) |
5.79 | 17.23 | 94.50 | 94.50 | 14.79 |
| Sprott Critical Materials ETF (Market Price)2 |
5.02 | 17.08 | 95.24 | 95.24 | 14.91 |
| Nasdaq Sprott Critical Materials™ Index (Benchmark)5 |
5.74 | 17.12 | 95.05 | 95.05 | 15.69 |
Performance data quoted represents past performance. Past performance does not guarantee future results. Current performance may be higher or lower than actual data quoted. Call 888.622.1813 or visit www.sprottetfs.com for current month end performance. The investment return and principal value of an investment will fluctuate so that an investor’s shares, when redeemed, may be worth more or less than their original cost.
* Returns less than one year are not annualized.
1 Inception Date: 2/1/2023.
2 Market Price is based on the midpoint of the bid/ask spread at 4 p.m. ET and does not represent the returns an investor would receive if shares were traded at other times.
3 The Premium/Discount is the amount (stated in dollars or percent) by which the selling or purchase price of an ETF is greater than (premium) or less than (discount) its face amount/value or net asset value (NAV).
4 Reflects Total Annual Operating Expenses as outlined in the most recent prospectus. For the services the Adviser (Sprott Asset Management USA, Inc.) provides to the Fund, the Adviser is entitled to receive an annual advisory fee from the Fund calculated daily and paid monthly at an annual rate of 0.65% of net assets.
5 The Nasdaq Sprott Critical Materials™ Index (NSETM™) was co-developed by Nasdaq® (the “Index Provider”) and Sprott Asset Management LP (the “Sponsor”). The Index Provider and Sponsor co-developed the methodology for determining the securities to be included in the Index and the Index Provider is responsible for the ongoing maintenance of the Index. The Sponsor will provide certain services in connection with the Index including contributing inputs in connection with the eligibility and process to determine the initial selection and ongoing composition of the Index constituents.
Market Price vs. Net Asset Value Since Inception
User Options: Mouse over the graph to view detailed daily values; click and drag your mouse to choose specific time frames. Click on the "Reset Zoom" button to return to the full timeline view.
Inception date: February 01, 2023.
Historical Premium/Discount: Market Price to Net Asset Value
User Options: Mouse over the graph to view detailed daily values; click and drag your mouse to choose specific time frames. Click on the "Reset Zoom" button to return to the full timeline view.
Inception date: February 01, 2023.
Frequency Distribution: Premium/Discount
Trading Days Each Quarter
Data updated as of February 27, 2026
| CY 2025 | Q1 2026 | Q2 2026 | Q3 2026 | Q4 2026 | |
| Days Traded at Premium | 204 | -- | -- | -- | -- |
| Days Traded at Discount | 40 | -- | -- | -- | -- |
Portfolio Characteristics*
As of 1/31/2026
| Number of Issuers | 127 |
| Market Cap (millions) | $778,882.57 |
| Weighted Avg. Company Market Cap (millions) | $19,827.39 |
| Market Cap Breakdown | |
| Large (>$10B) | 48.26% |
| Medium ($2 -$10B) | 35.94% |
| Small (<$2B) | 15.80% |
| Material Weightings††† | |
| Uranium Equities | 28.56% |
| Copper Equities | 25.99% |
| Lithium Equities | 17.77% |
| Rare Earths Equities | 12.59% |
| Silver Equities | 10.40% |
| Nickel Equities | 3.30% |
| Manganese Equities | 0.77% |
| Recyclers Equities | 0.37% |
| Graphite Equities | 0.26% |
††† Reflects equities classified by Sprott Asset Management.
Company Domicile Breakdown*
As of 1/31/2026
* Excludes cash
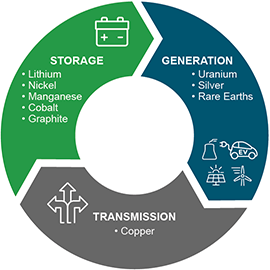
Critical Materials: Natural materials that are essential to the generation, transmission and storage of clean energy. SETM provides investors access to the miners who produce uranium, lithium, copper, nickel, silver, manganese, cobalt, graphite and rare earth elements.
Holdings
As of 2/26/2026
| Security | Market Value | Symbol | SEDOL | Quantity | Weight |
|---|---|---|---|---|---|
| Freeport-McMoRan Inc. | $31,988,711.04 | FCX | 2352118 | 467,808.00 | 5.32% |
| First Majestic Silver Corp. | $30,513,889.40 | AG | B01DH95 | 981,154.00 | 5.08% |
| NAC Kazatomprom JSC | $29,574,419.70 | KAP LI | BGXQL36 | 363,769.00 | 4.92% |
| Albemarle Corp. | $28,624,390.05 | ALB | 2046853 | 154,785.00 | 4.76% |
| PLS Group Ltd. | $28,273,596.72 | PLS AU | B2368L5 | 7,572,854.00 | 4.70% |
| Cameco Corp. | $26,828,514.52 | CCJ | 2158684 | 227,014.00 | 4.46% |
| Lynas Rare Earths Ltd. | $25,984,944.24 | LYC AU | 6121176 | 2,119,446.00 | 4.32% |
| Uranium Energy Corp. | $20,650,495.30 | UEC | B0VLLY2 | 1,342,685.00 | 3.44% |
| MP Materials Corp. | $19,493,940.00 | MP | BN15Y35 | 324,899.00 | 3.24% |
| Paladin Energy Ltd. | $16,946,099.26 | PDN AU | 6668468 | 1,783,615.00 | 2.82% |
| Lundin Mining Corp. | $16,931,058.43 | LUN CN | 2866857 | 534,808.00 | 2.82% |
| Teck Resources Ltd. | $16,432,535.70 | TECK | 2124533 | 269,430.00 | 2.73% |
| Antofagasta PLC | $16,353,680.08 | ANTO LN | 0045614 | 284,531.00 | 2.72% |
| Denison Mines Corp. | $14,263,055.10 | DNN | B0122F3 | 3,348,135.00 | 2.37% |
| NexGen Energy Ltd. | $13,854,399.68 | NXE | BCH0BB4 | 1,085,768.00 | 2.31% |
| First Quantum Minerals Ltd. | $13,831,250.83 | FM CN | 2347608 | 457,602.00 | 2.30% |
| IGO Ltd. | $13,640,920.00 | IGO AU | 6439567 | 2,147,979.00 | 2.27% |
| Southern Copper Corp. | $13,286,041.72 | SCCO | 2823777 | 61,595.00 | 2.21% |
| Liontown Ltd. | $10,748,103.78 | LTR AU | B1J89V5 | 8,327,086.00 | 1.79% |
| Energy Fuels Inc. | $10,217,725.24 | UUUU | BFV4XW8 | 447,361.00 | 1.70% |
| Aya Gold & Silver Inc. | $9,668,036.77 | AYA CN | BK94091 | 474,063.00 | 1.61% |
| CGN Mining Co. Ltd. | $8,262,135.42 | 1164 HK | B755514 | 13,005,050.00 | 1.37% |
| Ganfeng Lithium Group Co. Ltd. | $8,111,529.39 | 1772 HK | BZ9NS11 | 921,000.00 | 1.35% |
| Endeavour Silver Corp. | $8,013,444.95 | EXK | B018TM7 | 571,165.00 | 1.33% |
| KGHM Polska Miedz SA | $7,880,094.87 | KGH PW | 5263251 | 87,603.00 | 1.31% |
| Iluka Resources Ltd. | $7,722,442.86 | ILU AU | 6957575 | 1,754,292.00 | 1.28% |
| Silvercorp Metals Inc. | $6,897,117.60 | SVM | B01DQT8 | 500,880.00 | 1.15% |
| Capstone Copper Corp. | $6,085,332.44 | CS CN | BMY5XY9 | 589,592.00 | 1.01% |
| Hudbay Minerals Inc. | $5,843,273.95 | HBM | B05BQ98 | 208,465.00 | 0.97% |
| Cia de Minas Buenaventura SAA | $5,535,439.92 | BVN | 2210476 | 134,584.00 | 0.92% |
| Americas Gold & Silver Corp. | $4,818,971.30 | USAS | BVMDRM4 | 509,405.00 | 0.80% |
| Sigma Lithium Corp. | $4,214,945.42 | SGML | BNM4ZD8 | 259,861.00 | 0.70% |
| Avino Silver & Gold Mines Ltd. | $4,047,766.80 | ASM | B05P311 | 438,070.00 | 0.67% |
| MMG Ltd. | $3,916,817.30 | 1208 HK | 6728793 | 2,909,920.00 | 0.65% |
| Aneka Tambang Tbk | $3,852,136.50 | ANTM IJ | 6053859 | 14,905,900.00 | 0.64% |
| Elevra Lithium Ltd. | $3,721,387.74 | ELV AU | BVBM1M0 | 638,159.00 | 0.62% |
| Merdeka Battery Materials Tbk PT | $3,458,907.31 | MBMA IJ | BMBR1M2 | 70,675,600.00 | 0.58% |
| Ivanhoe Mines Ltd. | $3,414,755.98 | IVN CN | BD73C40 | 298,884.00 | 0.57% |
| Vale Indonesia Tbk PT | $3,323,100.87 | INCO IJ | B0217K9 | 7,842,050.00 | 0.55% |
| AbraSilver Resource Corp. | $3,319,235.53 | ABRA CN | BR4XSQ5 | 264,312.00 | 0.55% |
| NioCorp Developments Ltd. | $3,266,458.44 | NB | BMYD3L0 | 580,188.00 | 0.54% |
| Nickel Industries Ltd. | $3,208,576.42 | NIC AU | BZ7NDP2 | 4,445,127.00 | 0.53% |
| Lithium Americas Corp. | $2,783,029.10 | LAC | BQ2LQL5 | 540,394.00 | 0.46% |
| Arafura Rare Earths Ltd. | $2,633,766.05 | ARU AU | 6711726 | 15,431,345.00 | 0.44% |
| Vizsla Silver Corp. | $2,609,115.60 | VZLA | BSB7Q07 | 621,218.00 | 0.43% |
| Tianqi Lithium Corp. | $2,572,067.16 | 9696 HK | BMZ3RS4 | 420,950.00 | 0.43% |
| Deep Yellow Ltd. | $2,465,705.97 | DYL AU | 6480275 | 1,313,334.00 | 0.41% |
| Taseko Mines Ltd. | $2,360,628.50 | TGB | 2592066 | 277,721.00 | 0.39% |
| Lindian Resources Ltd. | $2,347,534.74 | LIN AU | 6214816 | 6,228,364.00 | 0.39% |
| Ur-Energy Inc. | $2,232,891.36 | URG | B0WW4L2 | 1,329,102.00 | 0.37% |
| Sandfire Resources Ltd. | $2,144,838.04 | SFR AU | 6739739 | 147,482.00 | 0.36% |
| ERO Copper Corp. | $2,141,212.64 | ERO CN | BF02Z72 | 62,259.00 | 0.36% |
| Lithium Argentina AG | $2,137,495.64 | LAR | BS2CSN8 | 269,206.00 | 0.36% |
| Critical Metals Corp. | $2,110,698.24 | CRML | BSNX0D4 | 193,998.00 | 0.35% |
| Standard Lithium Ltd. | $2,109,665.80 | SLI | BF0QWN9 | 458,623.00 | 0.35% |
| Sunrise Energy Metals Ltd. | $2,084,088.82 | SRL AU | BN4MX14 | 367,241.00 | 0.35% |
| Eramet SA | $2,002,715.69 | ERA FP | 4017017 | 28,117.00 | 0.33% |
| Encore Energy Corp. | $1,915,565.95 | EU CN | BN48958 | 698,824.00 | 0.32% |
| Hindustan Copper Ltd. | $1,844,274.35 | HCP IN | B02GZ11 | 287,231.00 | 0.31% |
| Trimegah Bangun Persada Tbk PT | $1,830,661.06 | NCKL IJ | BP69061 | 21,226,800.00 | 0.30% |
| Meteoric Resources NL | $1,825,605.58 | MEI AU | B01CRT2 | 12,835,559.00 | 0.30% |
| Boss Energy Ltd. | $1,811,892.66 | BOE AU | B1XLCQ6 | 1,498,723.00 | 0.30% |
| NGEx Minerals Ltd. | $1,508,946.77 | NGEX CN | BVBCQW5 | 65,513.00 | 0.25% |
| Pensana PLC | $1,502,701.19 | PRE LN | BKV4DS9 | 985,639.00 | 0.25% |
| Australian Strategic Materials Ltd. | $1,318,570.71 | ASM AU | BMTTJZ9 | 1,120,323.00 | 0.22% |
| New Pacific Metals Corp. | $1,154,892.96 | NEWP | BMX73Y6 | 201,552.00 | 0.19% |
| Vulcan Energy Resources Ltd. | $1,104,352.96 | VUL AU | BKYBH63 | 389,200.00 | 0.18% |
| Talon Metals Corp. | $1,093,357.37 | TLO CN | BTZRRJ6 | 182,633.40 | 0.18% |
| Brazilian Rare Earths Ltd. | $1,048,568.52 | BRE AU | BMVMLB6 | 286,304.00 | 0.17% |
| Jupiter Mines Ltd. | $994,034.36 | JMS AU | BF4J2C3 | 4,659,271.00 | 0.17% |
| Bannerman Energy Ltd. | $994,031.16 | BMN AU | B07DXJ1 | 308,560.00 | 0.17% |
| Uranium Royalty Corp. | $984,102.15 | UROY | BL7BHH8 | 225,195.00 | 0.16% |
| Sungeel Hitech Co. Ltd. | $977,864.09 | 365340KS | BP2SMJ9 | 22,239.00 | 0.16% |
| Minsur SA | $958,348.38 | MINSURI1 | 2595797 | 475,630.00 | 0.16% |
| Aclara Resources Inc. | $916,150.84 | ARA CN | BMG55Q3 | 363,287.00 | 0.15% |
| American Battery Technology Co. | $895,741.44 | ABAT | BQC80B4 | 233,266.00 | 0.15% |
| Mkango Resources Ltd. | $888,743.34 | MKA LN | BDHL9H6 | 1,155,647.00 | 0.15% |
| Core Lithium Ltd. | $883,239.05 | CXO AU | B4XFS83 | 4,686,733.00 | 0.15% |
| ATALAYA MINING COPPER SA | $853,385.74 | ATYM LN | BYZTVM8 | 62,874.00 | 0.14% |
| Magna Mining Inc. | $846,874.41 | NICU CN | BLDC8H2 | 363,187.00 | 0.14% |
| IsoEnergy Ltd. | $832,384.12 | ISO CN | BTTRKM6 | 73,137.00 | 0.14% |
| Ivanhoe Electric Inc. / US | $779,255.40 | IE | BPF0KH6 | 46,662.00 | 0.13% |
| Blackrock Silver Corp. | $765,394.54 | BRC CN | BNGHFP5 | 508,300.00 | 0.13% |
| MOIL Ltd. | $758,447.08 | MOIL IN | B4NRBT1 | 223,658.00 | 0.13% |
| Guanajuato Silver Co. Ltd. | $756,327.75 | GSVR CN | BMDM727 | 1,326,531.00 | 0.13% |
| Northern Minerals Ltd. | $717,489.72 | NTU AU | B1FMNY2 | 34,790,087.00 | 0.12% |
| Andean Precious Metals Corp. | $696,165.13 | APM CN | BNDS6V4 | 90,103.00 | 0.12% |
| Pam Mineral Tbk PT | $677,006.27 | NICL IJ | BP2PSH0 | 10,503,000.00 | 0.11% |
| Peninsula Energy Ltd. | $655,929.88 | PEN AU | 6486381 | 1,213,617.00 | 0.11% |
| European Lithium Ltd. | $650,042.34 | EUR AU | BDGJNV3 | 3,515,654.00 | 0.11% |
| Silver Mines Ltd. | $629,533.02 | SVL AU | B1HMJH5 | 3,848,828.00 | 0.10% |
| Unico Silver Ltd. | $620,814.51 | USL AU | BQXR4J6 | 980,866.00 | 0.10% |
| Lotus Resources Ltd. | $610,834.71 | LOT AU | BK6XLC1 | 394,008.00 | 0.10% |
| Canada Nickel Co. Inc. | $527,016.56 | CNC CN | BLHTRV6 | 351,700.00 | 0.09% |
| ioneer Ltd. | $519,347.83 | INR AU | BGYBHZ4 | 4,711,557.00 | 0.09% |
| Rainbow Rare Earths Ltd. | $516,823.71 | RBW LN | BD59ZW9 | 1,915,297.00 | 0.09% |
| Global Atomic Corp. | $514,875.55 | GLO CN | BF11BK3 | 809,627.00 | 0.09% |
| Solaris Resources Inc. | $504,093.83 | SLS CN | BMQ5701 | 48,668.00 | 0.08% |
| Xinjiang Xinxin Mining Industry Co. Ltd. | $502,890.82 | 3833 HK | B24FHB4 | 1,479,000.00 | 0.08% |
| Syrah Resources Ltd. | $496,146.86 | SYR AU | B23HV20 | 2,968,795.00 | 0.08% |
| FireFly Metals Ltd. | $480,415.94 | FFM AU | BPDXXB2 | 312,753.00 | 0.08% |
| PMET Resources Inc. | $446,158.76 | PMT AU | BP2VWP4 | 1,072,436.00 | 0.07% |
| Amerigo Resources Ltd. | $432,147.36 | ARG CN | 2855822 | 94,140.00 | 0.07% |
| American Rare Earths Ltd. | $428,827.06 | ARR AU | BMHKT87 | 1,608,010.00 | 0.07% |
| Silver X Mining Corp. | $400,176.69 | AGX CN | BMBYK71 | 467,916.00 | 0.07% |
| Atex Resources Inc. | $391,130.15 | ATX CN | BJLHNG9 | 125,020.00 | 0.07% |
| Faraday Copper Corp. | $388,050.06 | FDY CN | BLNNJN8 | 98,492.00 | 0.06% |
| Aftermath Silver Ltd. | $385,784.85 | AAG CN | BDFS6H8 | 436,176.00 | 0.06% |
| Lifezone Metals Ltd. | $373,608.40 | LZM | BLCY1J2 | 82,840.00 | 0.06% |
| Nouveau Monde Graphite Inc. | $348,676.80 | NMG | BMTR4P8 | 145,282.00 | 0.06% |
| Arizona Sonoran Copper Co. Inc. | $326,334.74 | ASCU CN | BMC50Y0 | 64,144.00 | 0.05% |
| Lake Resources NL | $314,450.46 | LKE AU | 6397267 | 4,421,708.00 | 0.05% |
| Imperial Metals Corp. | $293,015.61 | III CN | 2878937 | 39,300.00 | 0.05% |
| Trilogy Metals Inc. | $285,177.06 | TMQ | BD89HT7 | 63,798.00 | 0.05% |
| SolGold PLC | $284,824.46 | SOLG LN | B0WD0R3 | 756,653.00 | 0.05% |
| Central Asia Metals PLC | $263,066.83 | CAML LN | B67KBV2 | 82,794.00 | 0.04% |
| Graphite One Inc. | $229,323.28 | GPH CN | BJ9N154 | 235,884.00 | 0.04% |
| Kootenay Silver Inc. | $224,400.43 | KTN CN | BR1YVC8 | 155,833.00 | 0.04% |
| AIC Mines Ltd. | $218,777.33 | A1M AU | BK9PVF7 | 452,409.00 | 0.04% |
| Philex Mining Corp. | $208,893.05 | PX PM | B1FHVG5 | 1,029,200.00 | 0.03% |
| Gruvaktiebolaget Viscaria | $200,335.98 | VISC SS | BNDXB92 | 100,137.00 | 0.03% |
| Westwater Resources Inc. | $192,109.15 | WWR | BJHG304 | 212,041.00 | 0.03% |
| Aeris Resources Ltd. | $172,788.51 | AIS AU | BZ8W0K2 | 458,434.00 | 0.03% |
| 29Metals Ltd. | $112,124.99 | 29M AU | BNNVRL0 | 379,920.00 | 0.02% |
| Midnight Sun Mining Corp. | $96,896.46 | MMA CN | B2NWY60 | 98,192.00 | 0.02% |
| Jinchuan Group International Resources Co. Ltd. | $26,473.56 | 2362 HK | 6373988 | 323,600.00 | 0.00% |
| Cash Equivalent | $848,847.23 | $848,847.23 | 0.20% |
126 total, excluding cash and cash equivalents. Subject to change.
Distributions
Ex-Date |
Record Date |
Payable Date |
Short-Term Capital Gains |
Long-Term Capital Gains |
Ordinary Income |
Total Distributions |
12/14/2023 |
12/15/2023 |
12/21/2023 |
$0.01 |
- |
$0.43 |
$0.44 |
12/12/2024 |
12/12/2024 |
12/19/2024 |
- |
- |
$0.31 |
$0.31 |
12/18/2025 |
12/18/2025 |
12/22/2025 |
- |
- |
$0.45 |
$0.45 |
Literature
Fact Sheet
Quarterly Investor Presentation
Index Rebalance
White Paper
FAQs
Year-End Distributions
Regulatory Documents
- Tailored Shareholder Report, December 31, 2025
- Semi-Annual Financial Statements and Other Important Information, June 30, 2025
- Tailored Shareholder Report, June 30, 2025
- Annual Reports Financial Statements and Other Important Information, December 31, 2024
- Tailored Shareholder Report, December 31, 2024
- Tailored Shareholder Report, June 30, 2024
- Semi-Annual Financial Statements and Other Important Information, June 30, 2024
- Summary Prospectus
- Statutory Prospectus
- Statement of Additional Information
- Annual Report, December 31, 2023
Commentary

Top 10 Themes for 2026
What are the 10 most important themes impacting global markets in 2026? We explore issues from deglobalization and fiscal dominance to the surge in gold, silver and critical materials, and provide our view of where opportunities and risks may be emerging.

Uranium Outlook 2026
VIDEO · JOHN CIAMPAGLIA · 12/30/2025
John Ciampaglia joins Jimmy Connor of Bloor Street Capital to discuss uranium’s outlook as government support for nuclear energy strengthens. Tightening supply, rising reactor demand and growing institutional involvement are fueling bullish expectations for uranium and related mining equities in 2026.

Metals & Mining: Year in Review, Future in Focus
BY WHITNEY GEORGE, JUSTIN TOLMAN AND ED COYNE · 12/17/2025
Host Ed Coyne speaks to Sprott CEO Whitney George and Portfolio Manager Justin Tolman about the firm's strong performance in 2025. Looking ahead to 2026, they anticipate continued opportunities, increased investor interest and ongoing M&A activity as the mining and metals space gains broader recognition.

Nasdaq Talk Your Ticker: SETM
BY STEVE SCHOFFSTALL · 12/5/2025
Steve Schoffstall joins Nasdaq’s Talk Your Ticker to discuss the Sprott Critical Materials ETF (SETM), highlighting its pure-play exposure to miners of nine essential metals and its role in diversifying portfolios amid rising energy demand and security concerns.

Lithium Gains Momentum in 2025
BY JACOB WHITE · 12/2/2025
Lithium has entered a renewed bull phase as tightening supply, rising global demand from EVs to data centers, and major strategic investments shift the market from surplus toward potential deficit. Governments, oil majors and tech giants are racing to secure supply, solidifying lithium's essential role in long-term energy security.

National Security, Mining Investment and the Future of Materials: A Critical Crossroads
BY STEVE SCHOFFSTALL · 11/27/2025
In this episode of Metals in Motion, Steve Schoffstall discusses how government initiatives and major private-sector investment are transforming the critical materials space. New U.S. equity stakes, global agreements and nuclear projects are accelerating efforts to rebuild secure domestic supply chains.
How to Purchase
Invest Now
Sprott ETFs are liquid, convenient investments that can be purchased like any regular stock through discount and full-service brokers. You can purchase and trade shares of Sprott ETFs directly through your online brokerage firm; these firms may include:
U.S. Investors

Canadian Investors


Contact Us
Investment Adviser
Sprott Asset Management USA, Inc.
320 Post Road, Suite 230
Darien, CT 06820
Telephone: 888.622.1813
Distributor and Sub-Adviser
ALPS
1290 Broadway, Suite 1100
Denver, CO 80203
Client Services
Financial Advisors and Investors
Telephone: 888.622.1813
Email: bullion@sprott.com
Standard Mail
Sprott ETFs
P.O. Box 1107
Denver, CO 80201
Overnight Mail
Sprott ETFs
1290 Broadway
Suite 1100
Denver, CO 80203